To ensure correct propagation methods were used for growing yeast ready to begin fermentation, research was conducted to find the ideal standard technique to be used for propagating Brettanomyces yeast cells. Starting from a single colony looped and inoculated into 100 ml of wort, cell counts along with cell viabilities were recorded daily to find growth curves during batch culture propagation. The batch cultures were further stepped up with an additional 500 ml of wort and the procedures repeated. The growth curve (Fig. 1) for B. bruxellensis strains (CMY001 & BSI-Drie) show a 2-phase growth pattern, while a 3-phase growth pattern was observed for B. claussenii (WLP645), B. bruxellensis (WLP650), and B. lambicus (WLP653). In all five strains a similar 96-hour (4 day) initial growth phase was observed. Three strains (WLP645, WLP650, and WLP653) rapidly increased in cell number, with exponential growth seen over the following 24 hours. However, B. bruxellensis (BSI-Drie) lagged in growth for 24 hours after the initial 96-hour growth phase, then grew exponentially for a further 72 hours reaching early stationary phase growth after 192 hours (8 days) of batch culture propagation. After the initial 96-hour growth phase B. bruxellensis (CMY001) lagged for 72 hours (3 days) before going through a logarithmic 24-hour growth phase and reaching max cell growth at 192 hours (8 days) of batch culture. All strains reached maximum cell counts between 168 and 192 hours (7-8 days) of batch culture propagation.
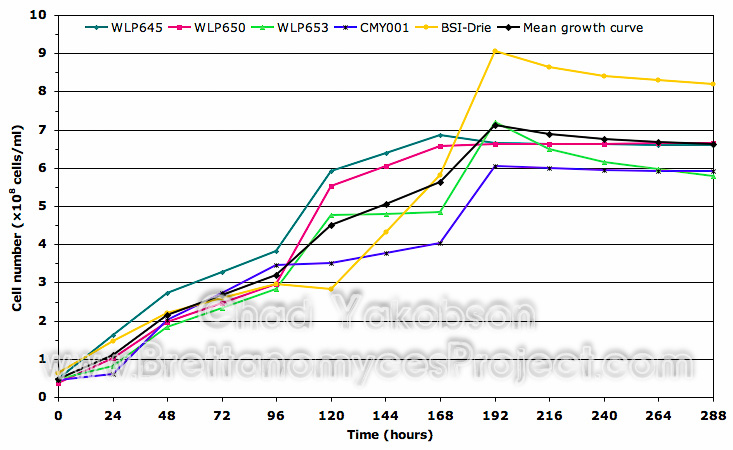
Figure 1. Growth curve for five strains of Brettanomyces during semi-aerobic batch culture. Cultures were grown in 500ml of wort substrate over a 288-hour period at 28°C with 80-rpm agitation. Viability was taken into account to reflect the actual cell number.
Growth Substrate Assay. Initial growth substrate was assessed using three strains of Brettanomyces (WY5112, WY5526, and WY5151). Each strain was inoculated into 100 ml of MYPG solution and 100 ml of wort for single strain, batch culture propagations. Batch cultures were grown as previously described, and stepped up into 500 ml of wort to observe the difference initial culture substrate made on cell growth. It was found initial growth substrate had a pronounced effect on overall cell growth (Fig. 2). Cell counts collected over 168 hours (7 days) of batch culture propagation from the three strains grown in MYPG solution had a collective mean of 11.38´108 cells/ml. This was 51.3% greater then the same three stains initially cultured in wort substrate (5.54´108 cells/ml). No lag phase or 2-phase growth pattern was observed in cells initially grown in MYPG solution, while a 24 hour lag phase was observed with cells initially grown in wort along with slowed growth over the 120 hours following the first 48 hours growth phase.
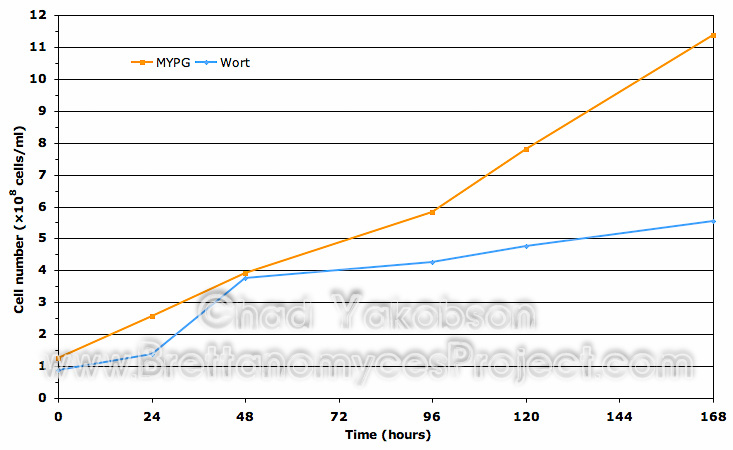
Figure 2. Growth curve comparison between the collective means of three Wyeast strains initially sub-cultured in MYPG substrate as compared to the same strains initially cultured separately in wort substrate. Both substrates were further inoculated into 500ml of wort substrate and grown for 168 hours (7 days) to observe initial impact on cell growth. Mean cell count data was obtained from all three Wyeast strains grown at 28°C with 80-rpm agitation.
Cell Viability. A comparison of cell viability (Fig. 3) shows similar results for cells initially cultured in MYPG substrate and wort substrate. A difference of cell viability for strains grown in wort substrate (mean value 99.73% ± 0.25%) was 3.05% higher to start then cells grown in MYPG substrate (mean value 96.68% ± 1.96%). After 120 hours (5 days) of batch culture propagation, both substrates had nearly equal viability with wort substrate (mean value 96.55% ± 2.23%) 0.15% higher then MYPG substrate (mean value 96.4% ± 0.1%). During batch culture a total drop in viability of 3.18% was observed in yeast cells grown in wort while 0.24% was observed in yeast cells grown in MYPG substrate.
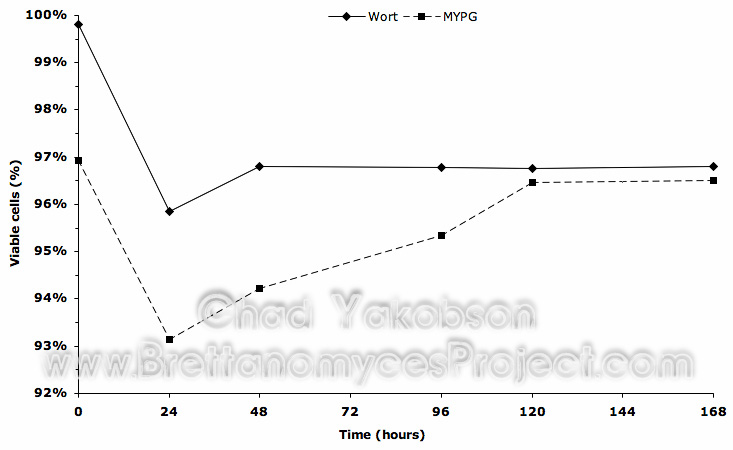
Figure 3. Cell viability comparison using the collective means of three Wyeast strains initially sub-cultured in MYPG substrate as compared to the same strains cultured separately in wort substrate. Both substrates were further inoculated into 500ml of wort substrate and grown for 168 hours (7 days) to observe initial impact on viability. Mean cell viability data was obtained from all three Wyeast strains grown at 28°C with 80-rpm agitation.
Quantitative Analysis. Batch culture propagations had samples collected for analysis of sugar utilization during semi-aerobic conditions. In each batch culture it was found that glucose, fructose and sucrose were completely utilized, as no measurable amounts were detectable (Fig. 4). A mean value of 27.0% (±2.83%) reduction in maltose was observed in yeast strains B. bruxellensis (WLP650), B. claussenii (WLP645), B. bruxellensis (BSI-Drie) and B. bruxellensis (CMY001). A 25.83% (±3.70%) reduction in maltotriose was observed for B. bruxellensis (WLP650), B. claussenii (WLP645), and B. bruxellensis (CMY001), while only a 4.8% reduction in maltotriose was observed for B. bruxellensis (BSI-Drie). B. lambicus (WLP653) was observed to have the greatest semi-aerobic utilization of fermentable sugars maltose (78.5%) and maltotriose (54%).
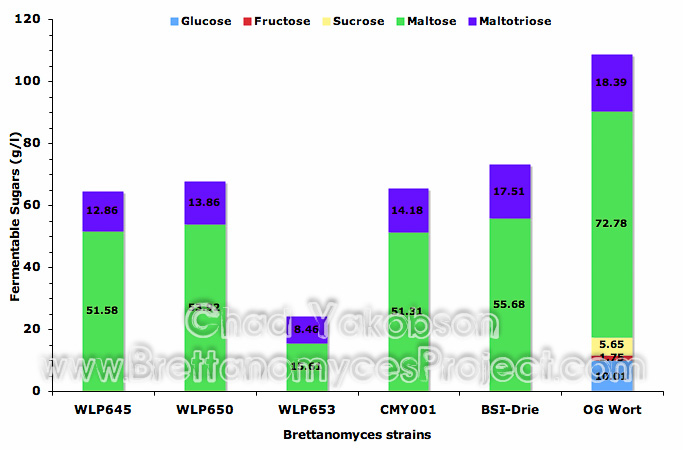
Figure 4. Mean fermentable sugars (g/l) present after batch culture propagation with five strains of Brettanomyces. All strains were grown under semi-aerobic conditions at 28°C with 80-rpm agitation in 500ml of wort for 12 days. Original gravity wort is shown as reference for initial sugars present.
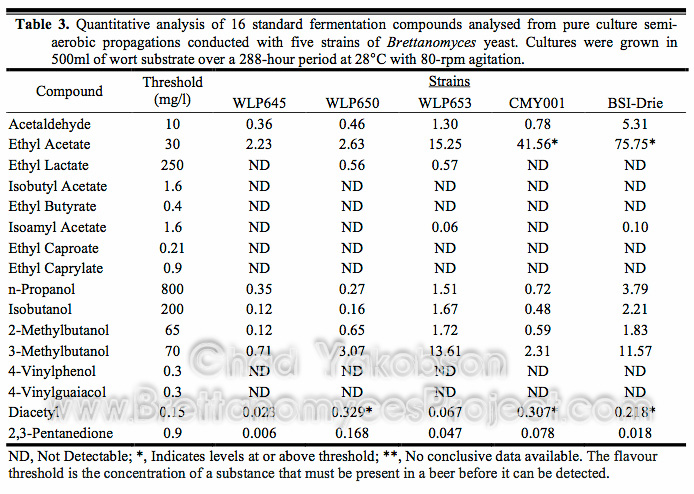
Further quantitative analysis of batch culture propagations were performed to examine compounds produced during semi-aerobic conditions. The values attained (Table 3) are present at levels well below threshold with most not detected. Ethyl acetate was the major compound present above threshold levels in B. bruxellensis (CMY001) and B. bruxellensis (BSI-Drie), measured at 41.56 mg/l and 75.75 mg/l respectively. Diacetyl was the only other compound present in B. bruxellensis (WLP650), B. bruxellensis (CMY001), and B. bruxellensis (BSI-Drie) at above threshold levels, with no detectable levels of volatile phenols produced.

